Real use differs
Cars may straddle two bays or park very close together.

Pilot · Technology validation
An experimental spatial perception approach that observes parking segments as continuous space — without relying on one sensor per bay.
Explore proposal“Measure the space actually occupied, not just painted bays.”
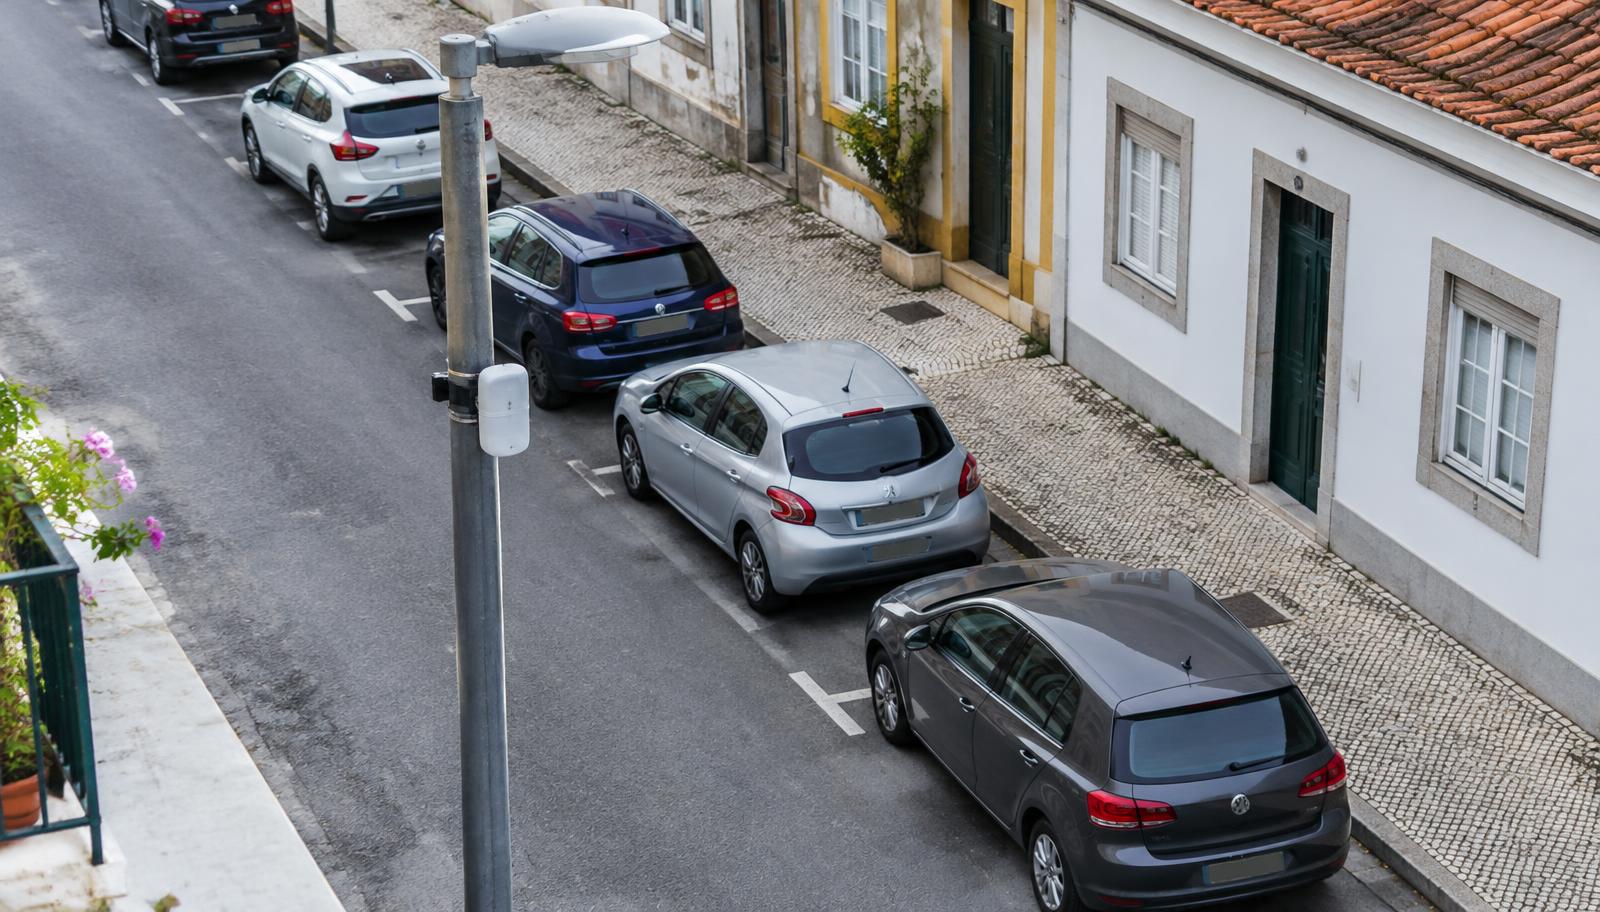
Cars may straddle two bays or park very close together.
One device per space means many devices to install and maintain.
Occupancy, dwell time and turnover inform parking policy.
Parking demand, urban pressure and low turnover call for up-to-date data. In practice, vehicles may partially occupy two bays or park very close together.
Elevated sensing points observe parking stretches and build a dynamic map of the kerbside space actually occupied and available.
The system separates the parking zone from the carriageway and uses spatial and temporal behaviour to distinguish traffic from vehicles that enter, stop, stay and leave.
Rather than relying only on painted bays, the solution measures how space is really used over time and prepares future integration with parking meters.
A sensing point on existing street furniture observes a whole segment.
The parking strip is separated from the traffic lane.
Vehicles that stop and stay are distinguished from passing traffic.
Free space, dwell time and turnover are shown by segment.
Elevated sensors covering full segments.
Local analysis; no images need to leave the device.
Occupancy, dwell and turnover by segment over time.
Maps and indicators for municipal teams.
Evidence for parking policy and urban planning.
Clear view of pressure points and turnover.
Future potential for guidance to available space.
Up-to-date occupancy by segment
Dwell time and turnover
Insight into real use of space
Potentially fewer devices than one sensor per bay
Future integration with parking meters
This proposal is presented as a pilot. Final capability and configuration will be determined by field tests — not as proven accuracy.
Indicative timeline, to be agreed with the partner.
Choose representative segments and mounting points.
Install elevated sensing points and configure zones.
Collect occupancy data and compare with manual checks.
Report on coverage, reliability and sensors per segment.